Claude Workspace Optimizer
Your setup is leaking context.
46% of our AI memory was invisible. 3,756 lines of rules loaded every session. One scan found it all. This free tool does the same for your workspace.
pip install claude-workspace-optimizerThen run claude-workspace-optimizer --open in your project directory

What the optimizer finds
Invisible Memory
MEMORY.md over 200 lines? Claude silently ignores everything after line 200. You're running with amnesia and don't know it.
Context Bloat
Reference material (SQL guides, API docs, framework templates) loaded on every session even when you're doing something completely unrelated.
Inline Memory Bloat
Full tables, code blocks, and multi-line content jammed into the memory index instead of linked topic files. Wastes your 200-line budget.
Missing Reference Tiering
Claude Code loads tool definitions on-demand, not all at once. Your rules should work the same way: core behavior always-on, reference material on-demand.
Requirements
- Python 3.10+ (check with
python --version) - Zero dependencies - pure Python stdlib
- Does NOT need to be installed inside your Claude Code workspace
- Read-only analysis - never modifies your files
How it works
Install (from anywhere)
pip install claude-workspace-optimizerPoint it at your project
claude-workspace-optimizer /path/to/your/project --openRead the report
Opens a visual HTML report in your browser with health score, issues, and prioritized recommendations.
Ask Claude to fix it
Feed the report to your Claude Code instance: "Read workspace-report/assessment.html and implement the P0 recommendations." Review the changes before accepting.
Before & after
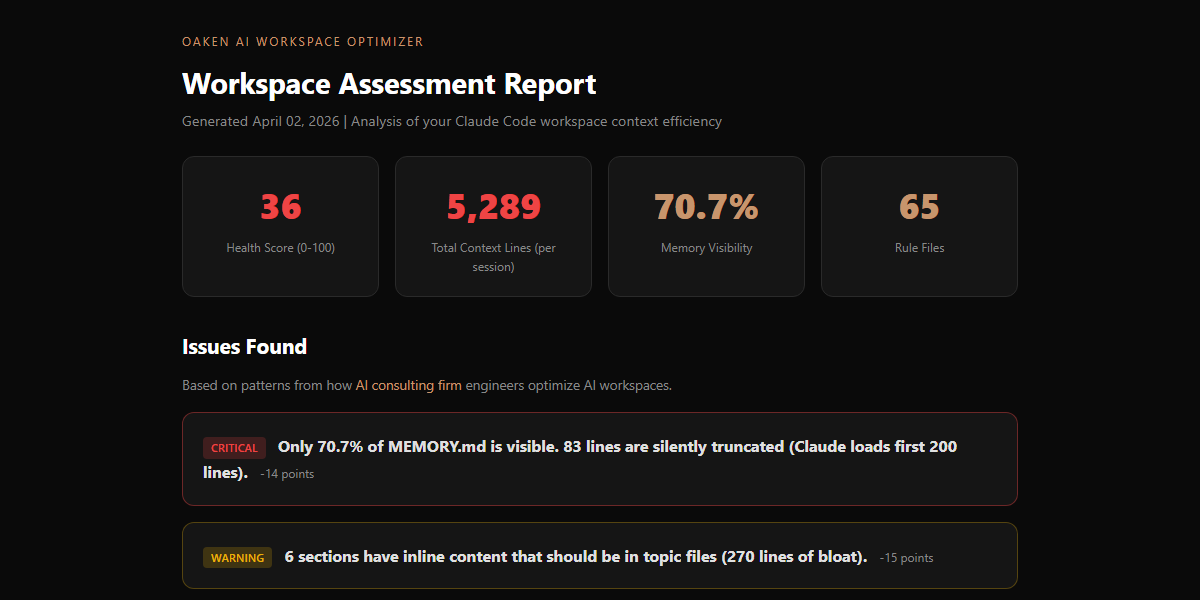
BEFORE - SCORE: 36/100
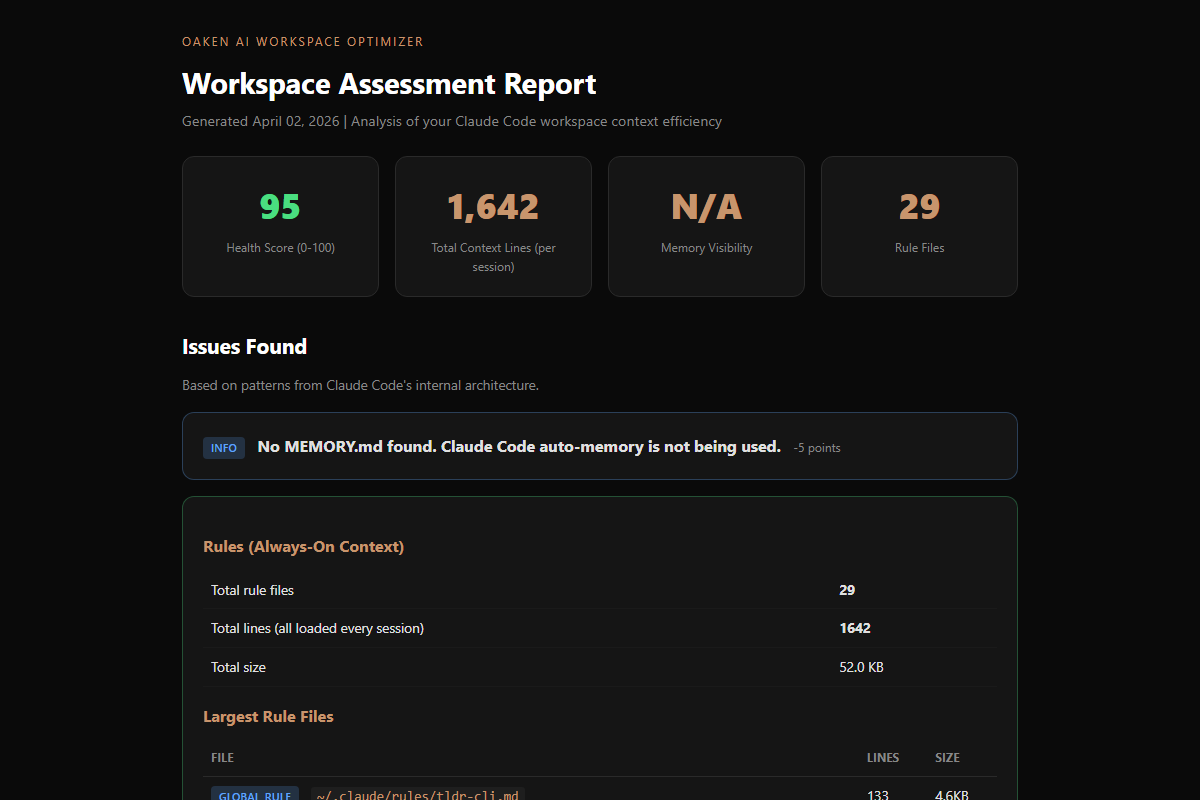
AFTER - SCORE: 85/100
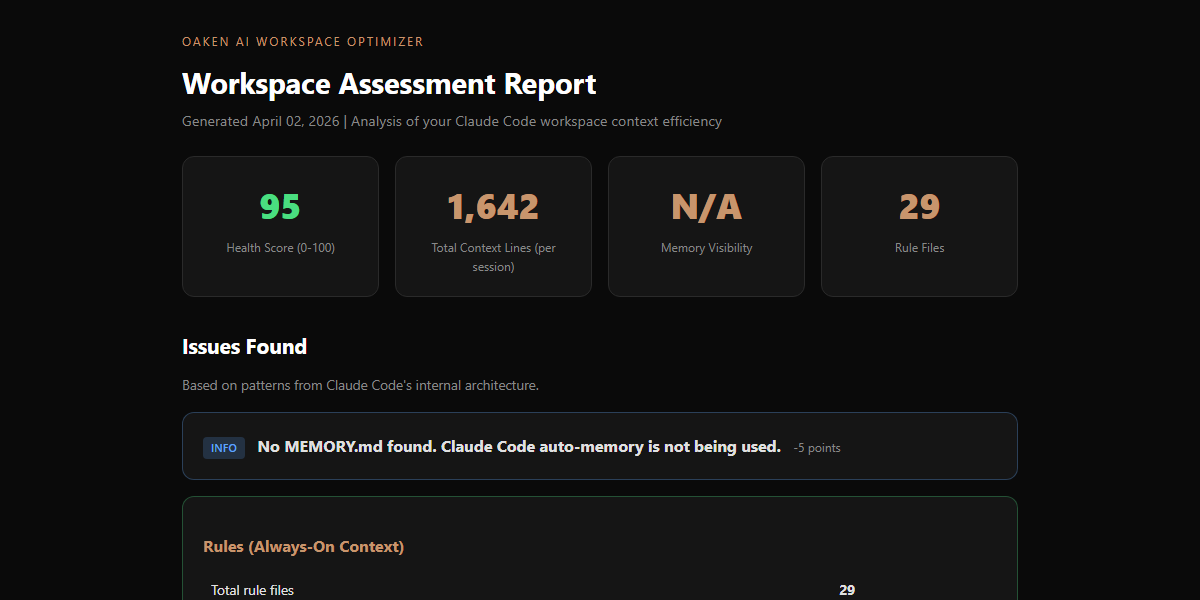
FULL ASSESSMENT REPORT
Our results: 66% less context, zero data lost
We built this tool after applying patterns from the Claude Code source leak to our own 462-skill, 18-container persistent AI environment.
| Metric | Before | After | Change |
|---|---|---|---|
| Memory index | 373 lines | 58 lines | -84% |
| Memory visibility | 54% | 100% | +46% |
| Always-on rules | 3,756 lines | 1,336 lines | -64% |
| Total session context | 4,129 lines | 1,394 lines | -66% |
| Topic files | 25 | 36 | +11 |
| Information lost | - | - | Zero |
Based on Claude Code's own architecture
The optimization patterns come from how Anthropic built Claude Code's memory system internally. These aren't guesses. They're engineering decisions from the team that built the tool.
Three-Layer Memory
Lightweight index (always loaded) pointing to topic files (on-demand). 200-line cap on the index. Each entry under 150 characters.
Reference Tiering
Core behavior rules always-on. Reference material (SQL patterns, API docs) loaded only when relevant. Not every session.
Memory Consolidation
Claude Code runs an internal 'autoDream' process that prunes, merges, and enforces budgets on memory. Memory that only grows eventually breaks.
Skeptical Verification
Memory is treated as a hint, not a fact. Before acting on something remembered, verify it against the actual codebase.
Frequently asked questions
Does this send my data anywhere?+
Does it work with any Claude Code project?+
Can it automatically fix the issues?+
Why is memory visibility so important?+
What's the ideal workspace health score?+
Share with your team
Know someone fighting Claude Code context issues? This tool is free. Share it.
pip install claude-workspace-optimizerMIT license. Open source. View on GitHub | View on PyPI
ALSO FROM OAKEN AI
Fixed your workspace? Now audit your agent architecture.
The Workspace Optimizer handles memory visibility and context bloat. The Agent Auditor goes deeper — checking autonomy risk, observability gaps, and whether your rules cover all four LLM failure modes from the Stanford CS230 framework.
Try the Claude Agent Auditor →Disclaimer: This tool is provided as-is with no warranty. Oaken AI and its contributors accept zero responsibility for any changes made to your workspace based on this tool's output. The report contains recommendations, not instructions. Always review changes before applying them. Back up your workspace before making modifications. If you use Claude Code to implement the recommendations, you are responsible for reviewing and approving all changes it makes.
Buy me a coffee
Fuel more free open-source AI tools
BUILT BY OAKEN AI
Need more than a workspace scan?
Oaken AI builds AI automation systems for businesses. From workspace optimization to full production pipelines, we help teams get more from their AI tools.